Simple and Dynamic Tables
The Pixel-Perfect Reports Builder provides Simple and Dynamic tables for displaying data.
You can only add tables to the body of the report.
Add a Simple Table
Simple tables display one object for each table cell. This object can be either static text or text resolved from a token. If you add a dataset column to a simple table, the cell displays the first record found in the dataset.
- Select the Simple Table icon in the toolbar.
- Navigate to the body of the canvas and draw a bounding box for the table. A blank table displays and the Configuration panel updates to display Simple Table Configuration options.
- In the Simple Table Configuration panel, specify the number of Columns and Rows in the fields provided. On the canvas, expand the table as needed to accommodate the number of columns and rows.
- Add and delete rows by selecting the dropdown menu in the header box of each row and selecting a delete or insert option.
- Add and delete columns by selecting the dropdown menu in the header box of each column and selecting a delete or insert option.
- To add static text to a table cell, select the cell and type your text. Use the settings in the Simple Table Cell Configuration panel to format the text.
- To add a token to a table cell, select the Token symbol
{}in the cell, and select an option from the dropdown menu. A string displays in the text box, which the system uses to resolve the token. You can only add one token per cell. - Format the table as needed using the Border and Padding settings in the Simple Table Cell Configuration panel.
Note: At any time, you can select Preview to preview the report. The Preview feature displays the actual data in the table.
Add a Dynamic Table
A dynamic table adds a row for each record in the dataset column. Unlike simple tables, you cannot add static text to the cells of a dynamic table, with the exception of the header row.
- Select the Dynamic Table icon in the toolbar.
- Navigate to the body of the canvas and draw a bounding box for the table. A blank table displays and the **Configuration&& panel updates to display dynamic table configuration options.
- In the Dynamic Table Configuration panel, select the Style tab and specify the number of Columns and Rows in the fields provided. Expand the table as needed on the canvas to accommodate the number of columns and rows.
- Add and delete rows by selecting the dropdown menu in the header box of each row and selecting a delete or insert option.
- Add and delete columns by selecting the dropdown menu in the header box of each column and selecting a delete or insert option.
- To add a header, select the table cell, enter your text, and use the options in the Dynamic Table Cell Configuration panel to format the text.
- To add a token to a table cell, select the Token symbol
{}in the cell, and select an option from the dropdown menu. A string displays in the text box, which the system uses to resolve the token. You can only add one token per cell. - Continue to design your table. Use the following advanced features as needed:
- To add a column to a table cell, see Add Column Data.
- To add a group to a table cell, see Add Groups.
- To add a table total, see Add Totals.
- Format the table as needed using the options on the Style tab.
Note: At any time, you can select Preview to preview the report. The Preview feature displays the actual data in the table.
Alternate Colors
Dynamic tables enable you to define alternating font and background colors to make the table easier to read. By default, alternate colors are not applied. To define alternating colors:
-
Select the table to display its Configuration panel.
-
Select the Style tab and configure the following settings:
- Font Color
- Background Color
- Alternate Font Color
- Alternate Background Color
The alternating colors are applied when the table is displayed, previewed, and exported.
Add Column Data
- Select the table on the canvas by selecting its grabber handle.
- Open the Data & Parameters panel and then open the Data tab.
- Open the Dynamic Table Configuration panel and then open the Data tab. If the Data tab does not display, select the Drag handle to select the table and refresh the Dynamic Table Configuration panel.
- Drag a column from the Data & Parameters panel to the Columns shelf on the Dynamic Table Configuration panel. The column name displays in the table on the canvas.
- Continue to add columns to the Column shelf.
- Change the order of the columns as needed. Drag the column names up and down in the Column shelf. To remove a column, drag it away from the Column shelf.
- Select Preview to preview the report using the data selected.
Add Groups
- Select the table on the canvas by selecting its grabber handle.
- Open the Data & Parameters panel and then open the Data tab.
- Open the Dynamic Table Configuration panel and then open the Data tab. If the Data tab does not display, select the Drag handle to select the table and refresh the Dynamic Table Configuration panel.
- Drag a column from the Data & Parameters panel to the Groups shelf on the Dynamic Table Configuration panel. The group name displays in the table on the canvas.
- Continue to add columns to the Groups shelf.
- Change the order of the columns as needed. Drag the column names up and down in the Group shelf. To remove a column, drag it away from the Group shelf.
- Select Preview to preview the report using the data selected.
Add Totals
-
Verify that the table is positioned on the canvas with sufficient empty space below it to fit an additional row.
-
Select the table on the canvas by selecting its grabber handle.
-
Open the Dynamic Table Configuration panel and open the Data tab. If the Data tab does not display, select the Drag handle to select the table and refresh the Dynamic Table Configuration panel.
-
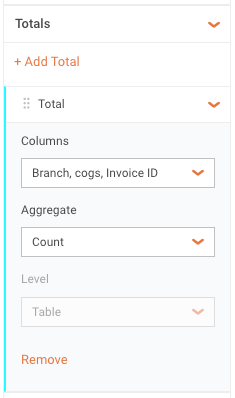
Under Totals, select Add Total. At the bottom of the table, a new row displays the total for each column.
-
In the Dynamic Table Configuration panel, select the dropdown next to the new total to display its settings.
-
Use the options provided to customize how the totals are displayed. You can also select Remove to remove the total.
-
Select Preview to preview the report using the data selected.